-
LoginClient login:
- Contact us
-


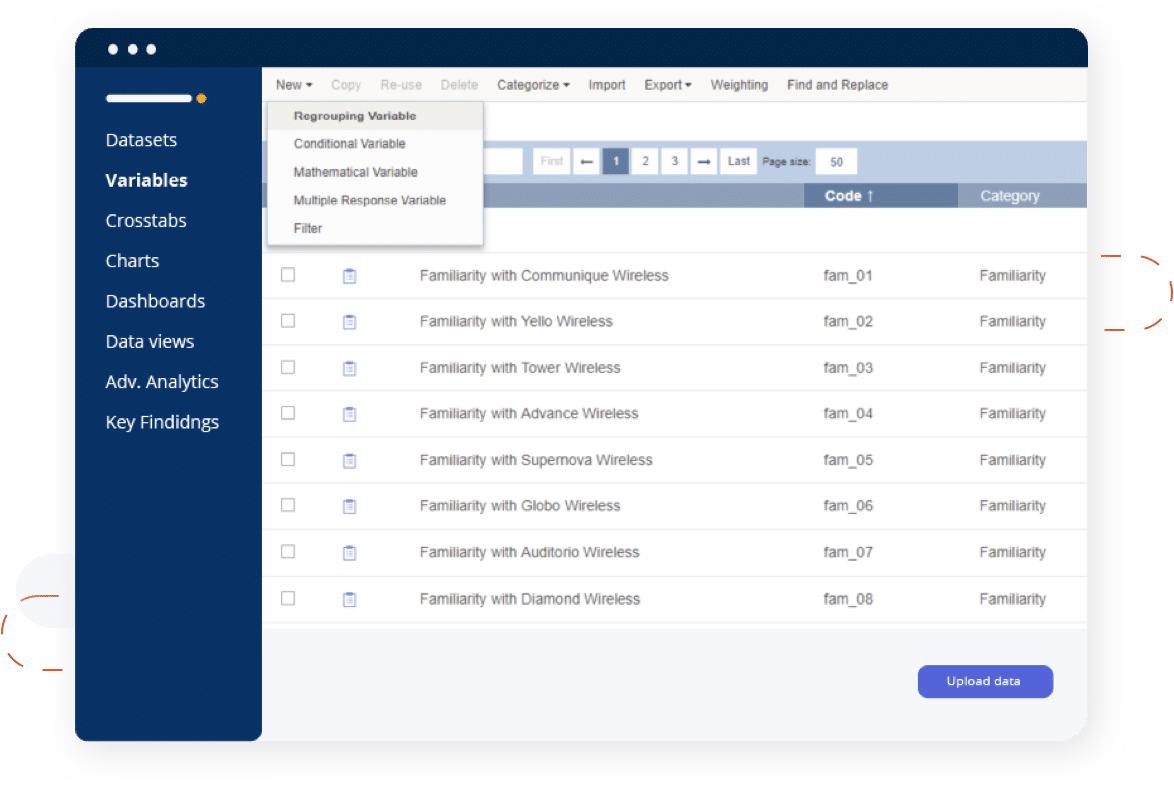
Upload, access and sync your data files with a fast and easy-to-use platform that works across all data formats.
Request a Trial
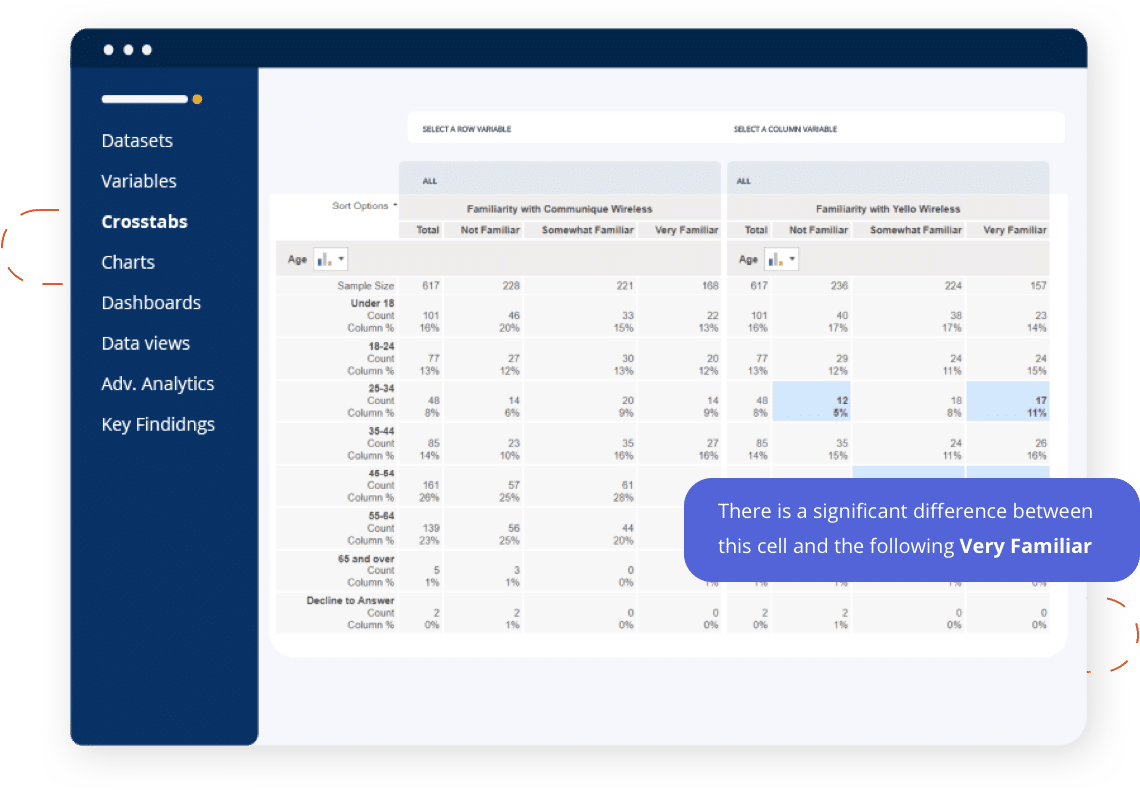
Uncover significant findings in seconds, while maintaining the highest quality data, using AI and feature-rich crosstabs.
Request a Trial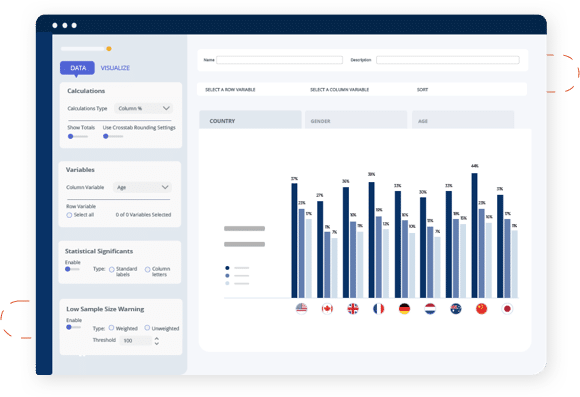
Instantly visualize findings and, with the click of a button, export them to native PowerPoint templates that will update with your latest data. Tight deadline? Automate reporting for faster delivery.
Request a Trial
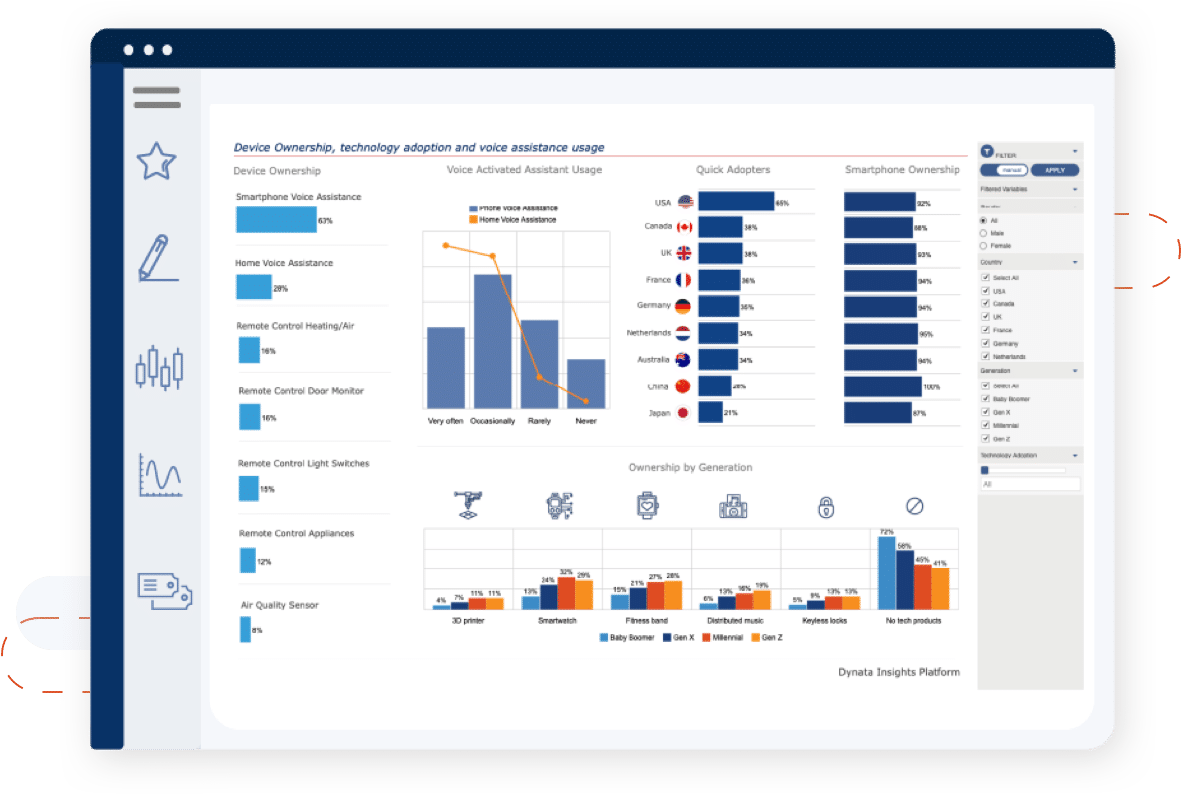
Illustrate insights by creating interactive visual dashboards with filter-driven custom views that update with each new wave of data.
Request a Trial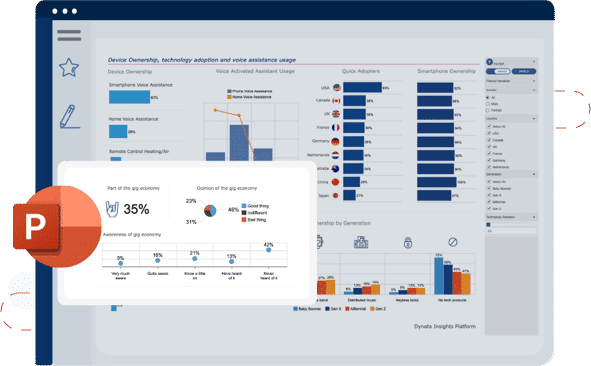
Maximize actionable results by sharing your insights using cloud-based collaboration, free and secure via branded PowerPoint, a secure online portal or interactive dashboards.
Request a Trial